Rivian's 🔥 Burning Cash to Scale
Tesla Model 3 vs Rivian R2
Cumulative net losses from founding to the launch of each company's first mass-market vehicle — the total money the business burned to get there. Toggle to inflation-adjust.
"Revenues to build" doesn't map cleanly onto any single line item, so I'm using the most defensible proxy for money each company consumed to put a mass-market EV into production: cumulative net loss since inception (accumulated deficit) at the close of each company's launch year, with every year's loss inflation-adjusted to 2026 dollars via CPI-U before summing.
The numbers, straight from the 10-Ks:
- Tesla's accumulated deficit was $4.97B at the end of 2017 (Model 3 deliveries began July 2017). sec
- Rivian's accumulated deficit was $27.0 billion as of December 31, 2025 (R2 customer deliveries began Q2 2026). Publicnow
Inflation-adjusted to 2026 dollars, Tesla's figure rises to ~$6.8B and Rivian's to ~$29.8B. So the gap narrows from ~5.4× nominal to ~4.4× real - Tesla burned its capital in cheaper, older dollars, but Rivian still consumed roughly 4–4.5× as much to reach the same milestone. Let me build the interactive version.
Synthesized chart interactivity and reinforced key takeaways conciselySynthesized chart interactivity and reinforced key takeaways concisely
Rivian's curve is dramatically steeper at the equivalent company age, and hovering gives you both companies' figures plus the calendar year each hit that age.
The takeaway holds up under inflation: Tesla reached the Model 3 having burned ~$6.8B in today's dollars; Rivian reached the R2 having burned ~$29.8B. Inflation explains part of the apparent gap (Tesla spent 2003–2017 dollars, Rivian spent 2020s dollars), but only shrinks it from 5.4× to 4.4× - Rivian's capital intensity to get to a mass-market EV is real, not a dollar-vintage illusion.
Two things worth keeping in mind if you build on this: accumulated deficit is "total money the company burned," which sweeps in R1/EDV/AV/software for Rivian and Model S/X/energy/SolarCity for Tesla - neither is the standalone cost of the car. And if you'd rather frame it as capital raised than capital consumed, the equity story is directionally similar (Rivian's paid-in capital was ~$31.5B at end-2025 vs Tesla's ~$9.2B at end-2017), though Tesla's includes the SolarCity acquisition, which is why I led with the cleaner burn metric. Happy to swap in capital-raised, add Lucid as a third bar, or recut the launch dates if you want Tesla measured pre-ramp instead.
How many R2s to profitability?
A model, not a forecast. Rivian's auto business runs a negative gross margin today, so everything hinges on one number it hasn't proven yet: R2's gross margin at scale. Drag the inputs and watch break-even move. Defaults are tuned to management's ~4,000/week "North Star."
2025 65k
2026E 208k
North Star break-even
Recent Writings

Agency is not about agents
Agency is not about agents. AI multiplies output for people qualified to filter it, and multiplies garbage for everyone else.
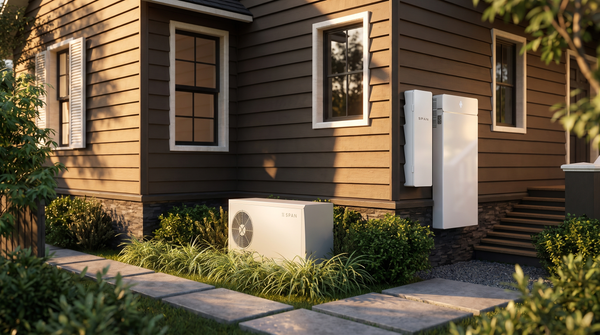
The Distributed Home Data Center Fallacy
In April 2026, SPAN announced XFRA, a distributed data-center architecture in which exterior-mounted compute nodes are used. It's fundamentally a bad idea.

Could extended-range EVs encourage more car buyers to opt for full electric?
Problem: The fundamental idea here is that current EVs with 300-400-mile ranges still don't work for large SUVs that Americans actually buy. No actual pickup truck has been built that's comparable to an F150 or F250 capable of doing real work in the United